

Let’s start a journey that brings your vision to life! 40 hours proof of concept for $2,500. Send your brief →

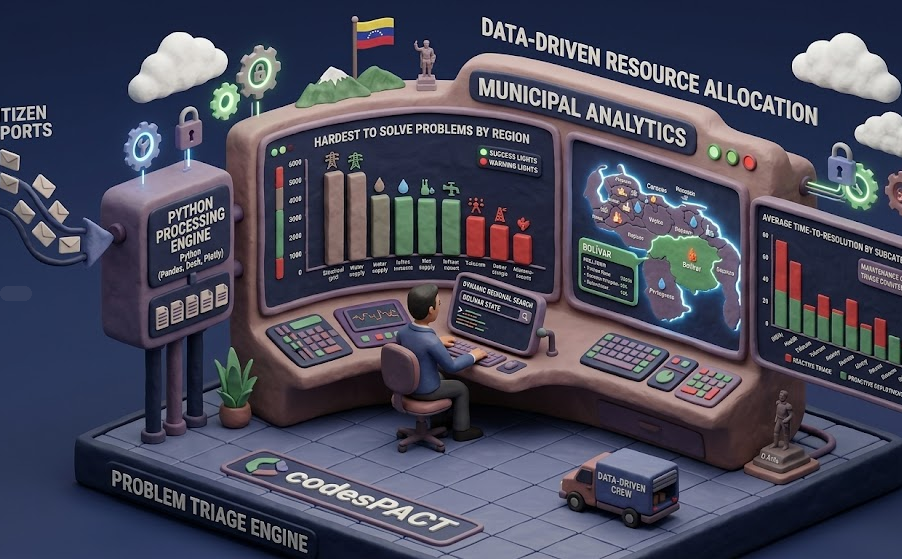
For large-scale civic operations, raw data is abundant but operational visibility is rare. We engineered the Municipal Analytics Dashboard, a Python-based data science application designed to ingest massive volumes of unstructured citizen reports and transform them into interactive, strategic intelligence for regional resource allocation.
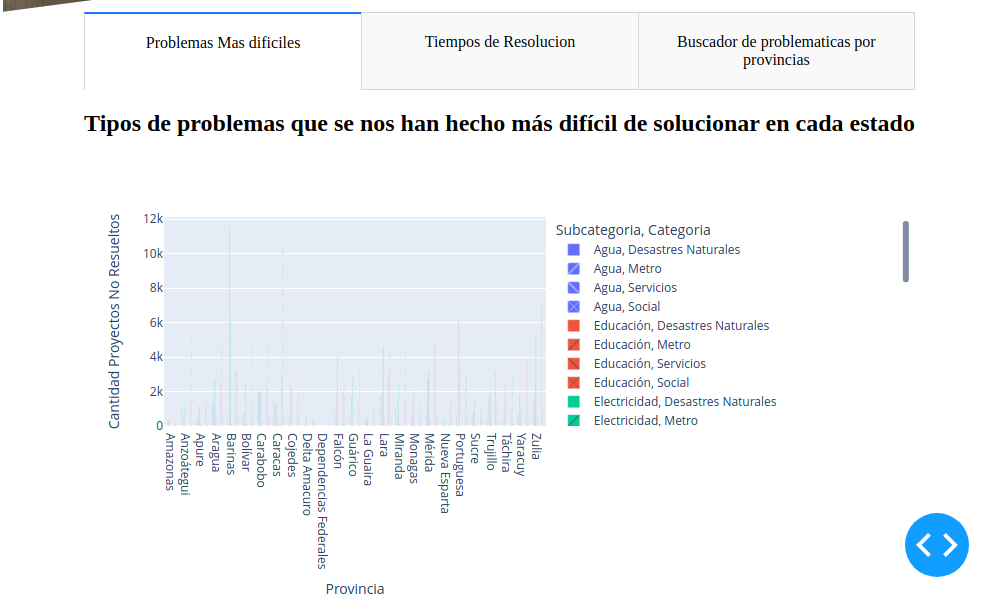
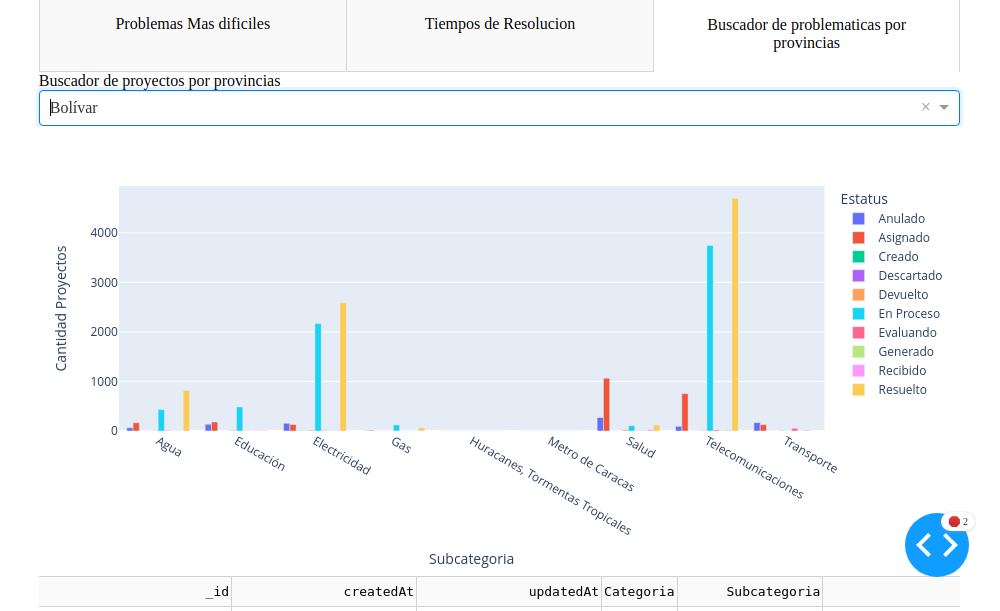
The primary dashboard view (shown below) instantly visualizes the “hardest to solve” problems across all states, allowing directors to spot operational friction and regional bottlenecks at a single glance.
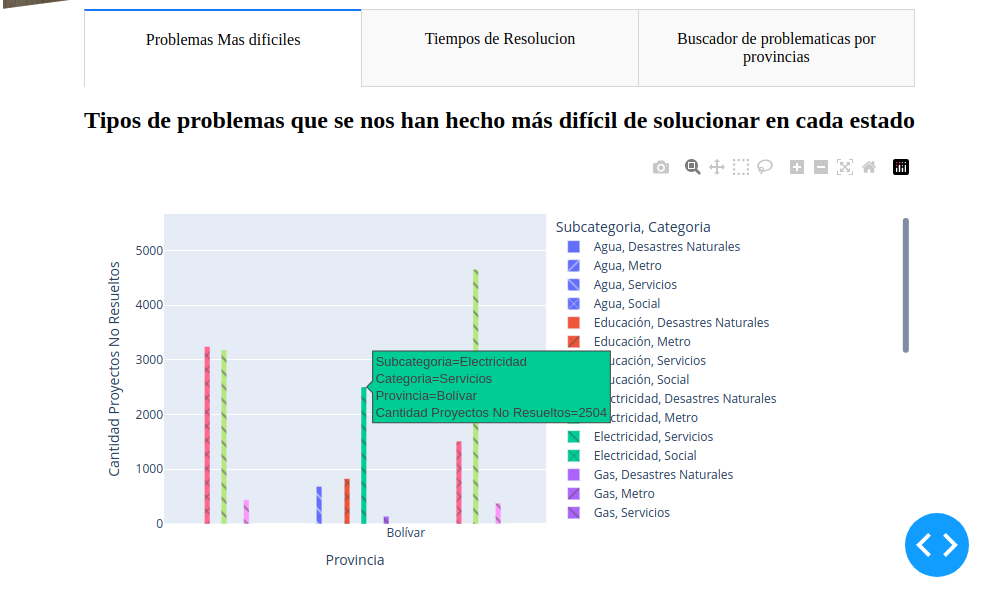
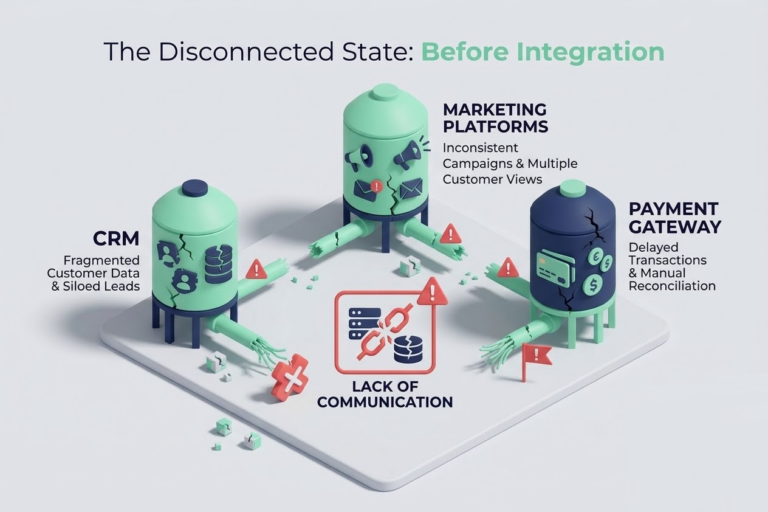
The Problem: The Bottleneck of Civic Triage
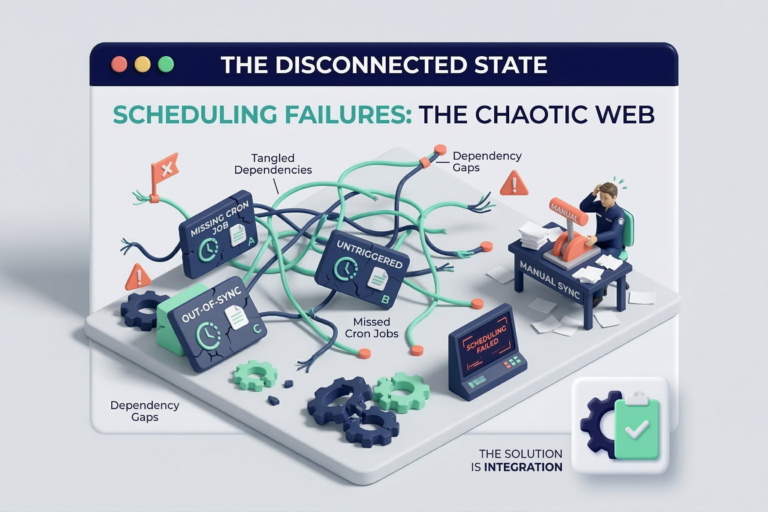
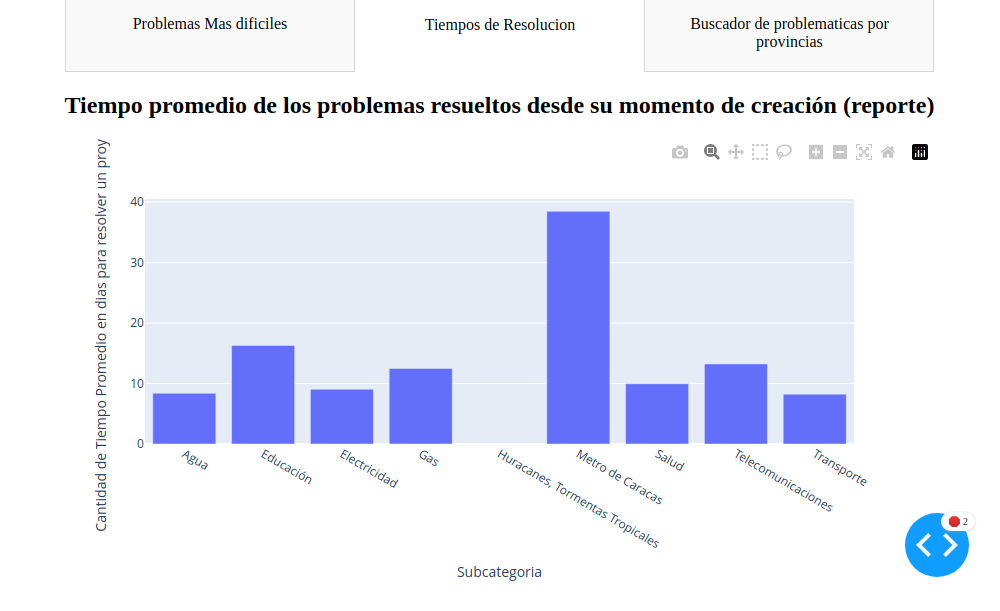
Municipalities and regional governments constantly receive thousands of incident reports—ranging from electrical grid failures to water supply disruptions. Historically, this data lived in static spreadsheets. Decision-makers were forced to rely on delayed reporting, making it nearly impossible to identify regional bottlenecks, track real-world resolution times, or deploy maintenance crews efficiently. When data is static, triage becomes entirely reactive.
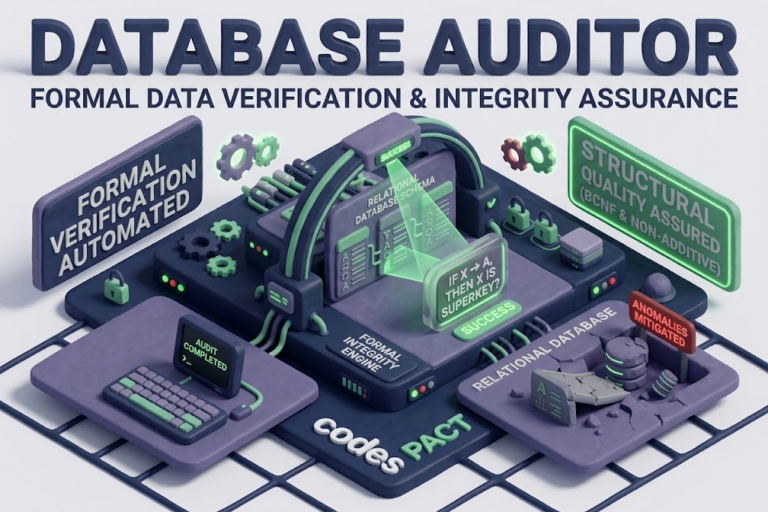
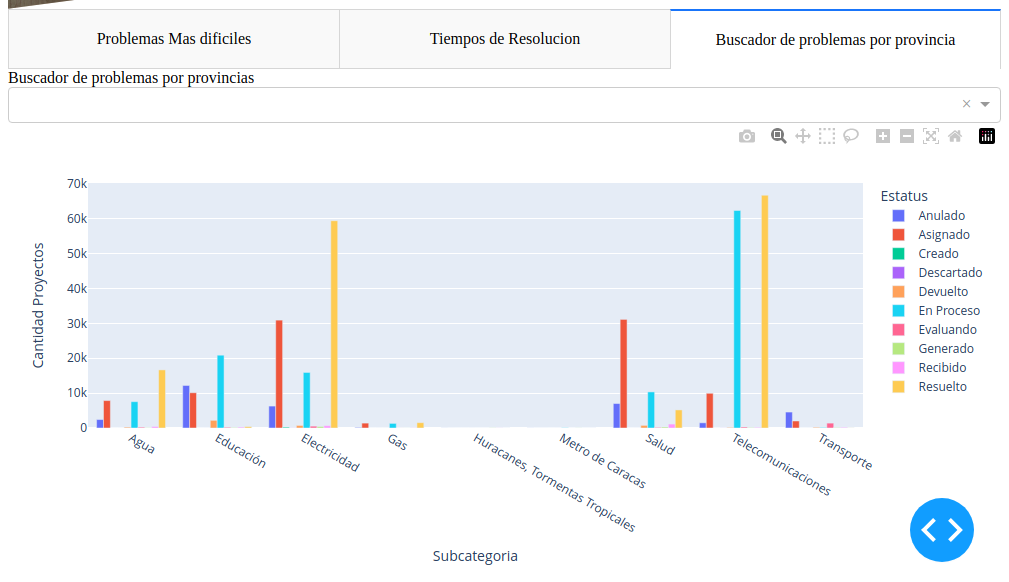
The Solution: An Interactive Data Processing Pipeline
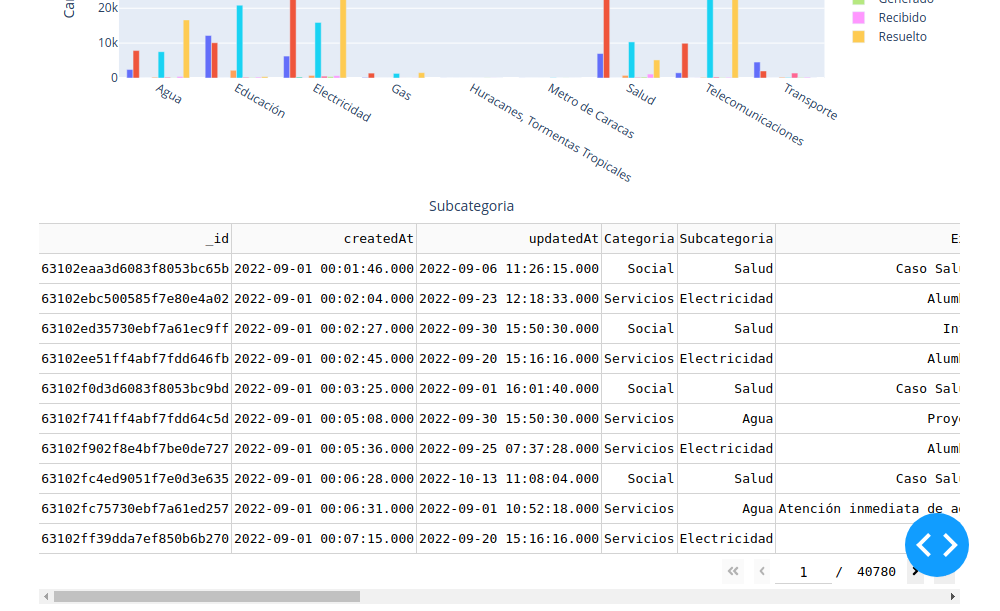
To solve this, we developed a dynamic analytical engine utilizing a robust Python stack (Pandas, Dash, and Plotly). The system doesn’t just display data; it actively processes tabular datasets, calculating statistics and rendering interactive operational dashboards in real time.
The Impact
The Municipal Analytics Dashboard bridges the gap between raw data collection and logistical execution. By automating exploratory data analysis (EDA) and providing a real-time visual interface, it empowers directors to move from reactive crisis management to proactive, data-driven resource deployment.
The Architecture Behind the Build Complex integrations require a clear vision. The underlying architecture and core development of Municipal Analytics Dashboard were spearheaded by our Solutions Architect, Israel Villaroel, ensuring the system wasn’t just intelligent, but built to scale and deploy seamlessly into real-world enterprise environments.